
Today is our topic of discussion Definition of Data
Definition of Data
Definition:
A set of values recorded on one or more observational units.
Types of data:
According to source:
Primary data –
Are those which are collected afreash and for the first time and thus happen to be original in character are known as primary data. Example: a questionnaire.
Secondary data –
Are those which have been collected by someone else and which have already been passed through the statistical process are known as secondary data. Example: data from a book.
According to the nature of the variable:
Qualitative data –
Qualitative data is a categorical measurement that takes non-numeric narrative values. It is also called ‘categorical’ data. For example: ‘Sex’, which takes the non- numeric narrative value of male or female.
Quantitative data –
Data that take numerical value. Example: Age measured in years.

Characteristics of data:
1. It is unprocessed, unorganised and discrete.
2. Data can be qualititative or quantitative. Example – The opinions of 1000 people about a government policy would be qualitative. Rainfall measurements would be quantitative.
3. Data can be detailed or sampled. Detailed data would facts about every occurrence of something. Sampled data would use few typical measurements to represent the whole.
4. Data can come in various forms: textual (e.g. names, addresses), numeric (e.g. heights, ages), graphical (c.g. picture of faces), aural (hearing based), visual (fingerprints).
Functions of data:
1. It provides reliable, relevant, up-to-date, adequate, timely and reasonably complete information for health managers at all level and at the sharing of information by all health personnel.
2. It provides information about general performance of health services.
3. Data based information utilized for making judgements, strategic decisions and predictions for policy planners.
Collection of data:
Using published records (secondary source) –
1. The census reports: Contains population distribution by age, sex, education, occupation, marital status, family size, per capita income etc.
2. Annual vital statistics reports: Contains data about number of live births, still births, deaths, marriages, divorces etc.
3. Medical text books and journals
4. Hospital Records
5. Annual epidemiological and statistical reports to
Conducting surveys (primary source) –
1. Mailed questionnaire method: Pre-designed questionnaire sent to the respondent who after completion mails it back to the sender.
2. Survey schedule method: Using face-to-face interview of selected respondents interview schedule.
Personal interview (primary source)
Telephone interview (primary source)
Conducting experiments (primary source)
Presentation of data:
Tabulation:
a. Frequency distribution
b. Table
Drawings:
a. Graph
b. Diagram
Frequency distribution:
The organization of data to show how often certain values or ranges of values occur. Example: Weight distribution of 30 patients given below –
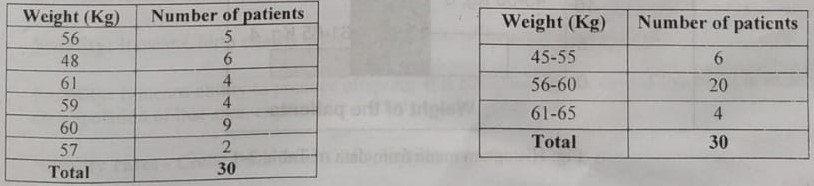
Table: Frequency distribution of weight of 30 patients in simple and grouped manner
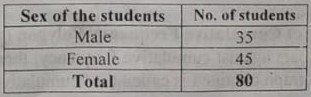
Table:
A table is a systematic organization of statistical data in columns and rows. A table should contain table no., title of the table, source etc. Example: Sex distribution of 80 students of Rampura MATS in tabular form as-
Presentation of data by drawings:
1Presentation of quantitative or numerical data is made through graphs. Example –
a. Histogram
b. Frequency polygon
c. Frequency curve
d. Cumulative frequency diagram or Ogive
e. Scatter or dot diagram f. Line chart or graph
2. Presentation of qualitative or categorical data is made through diagrams. Example –
a. Bar diagram
b. Pie chart or pie diagram
c. Pictogram or picture diagram
d. Map diagram
See also :